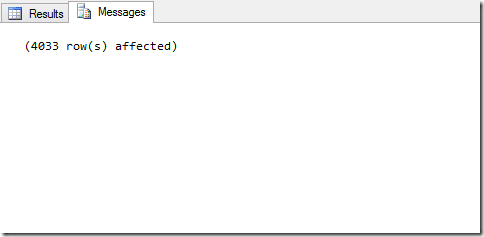
I am often working on SQL Server as my database backend. When trying to determine how efficient two different database queries might be I find it helpful to use statistics available to determine hard performance numbers instead of gut feel or using my trusty stop watch. When you run a query you get the two tabs shown below.
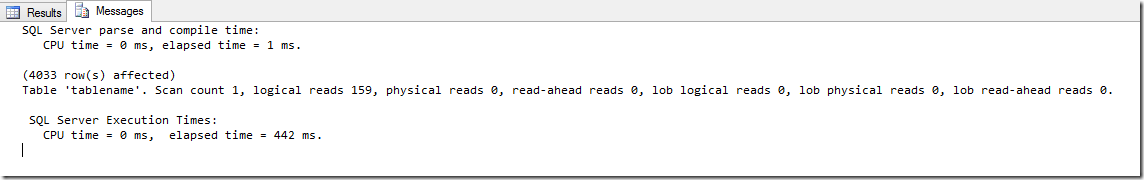
The messages tab usually does not have much information but you can change that with two simple commands. If you run the following two commands in your query window the messages tab will contain a lot more information about the resources your query required to complete.
SET STATISTICS IO ON
SET STATISTICS TIME ON
After running the same simple “select * from tablename” query as above you get the following results.
There are three parts of this I often use.
1. Scan Count
This gives you the number of table or index scans that were required to complete the query. In this case a single table scan is expected since this is pulling all data from a single table and there are no indexes on the table. If this number is large it can be an issue in performance. If this is the case I normally switch to looking at the execution plan, but that is for another blog post.
2. Logical Reads and Physical Reads
These numbers tell us either the number of reads made to the storage device (physical reads) or the number of reads that would have been made to the storage device if the data had not been cached (logical reads). In this example the table was already in RAM on the SQL server so all the reads were logical.
3. Elapsed Time
This is my favorite number since it gives me the ability to compare sub-second queries to each other. The example took 442ms (.4 seconds). If you had a query that was doing the same thing but took 800ms it would be pretty easy to choose from them.
How to use these numbers
There are no absolute right and wrong numbers to see. Generally lower is better but there are times when scan count might be high but performance is not affected. You might see a query where the CPU time is greater than the elapsed time. This generally means the query is CPU intensive. This is also not necessarily a bad thing, just something you want to be aware of. Hopefully these commands will give you a little more information about your queries so you can make good decisions.